ThreadSpotter™
ThreadSpotter™ is a tool to quickly analyze an application for a range of performance problems, particularly related to multicore optimization.
A modern processor has two types of resources that are both limited and highly responsible for application performance: - The memory bus, which transports data between the memory and the processor, and
- The caches, which store often used data so each access doesn't have to go all the way to memory.
A third resource, the hardware prefetcher, is also important for application performance, as it anticipates the application's memory access patterns, and tries to fetch data ahead of time. If it is successful, this hides some of the time it takes to access memory. It is of great importance for application performance and scalability on multicore processors that these resources are used efficiently. ThreadSpotter™ looks for abuse of these resources and points out the responsible slowspots.
Your application
Application:
./build-x86-octotiger/octotiger
-Disableoutput
-Problem=moving_star
-Max_level=6
-Stopstep=0
-Xscale=32
-Odt=0.5
--hpx:threads=24
-Ihpx.stacks.use_guard_pages=0
 | Memory Bandwidth The memory bus transports data between the main memory and the processor. The capacity of the memory bus is limited. Abuse of this resource limits application scalability.
Manual: Bandwidth |
 | Memory Latency The regularity of the application's memory accesses affects the efficiency of the hardware prefetcher. Irregular accesses causes cache misses, which forces the processor to wait a lot for data to arrive.
Manual: Cache misses Manual: Prefetching |
 | Data Locality Failure to pay attention to data locality has several negative effects. Caches will be filled with unused data, and the memory bandwidth will waste transporting unused data.
Manual: Locality |
 | Thread Communication / Interaction Several threads contending over ownership of data in their respective caches causes the different processor cores to stall.
Manual: Multithreading |
This means that your application shows opportunities to:
Tune cache utilization to avoid processor stalls.
Read more...
Given the current input set, this application is not putting high pressure on the memory bus, but other input sets may well have different characteristics and behave worse.
Only a small portion of the data transferred over the memory bus, and loaded into the cache, is used by this application before being evicted from the cache again. This is disadvantageous in three respects:
-
The cache is filled with lots of data that this application is not using. This essentially reduces the effective size of the cache since there is less space for actually used data. A smaller effective size makes the cache less effective and increases the number of cache misses.
-
Each time new data is brought into the cache, only a a fraction of it is useful. For that reason, new data has to be brought into the cache more often. This increases the number of times a processor will have to stall waiting for data.
-
The memory bus is used to transfer data which is not used. This increases the amount of data transferred across the memory bus, leading to more contention for the memory bus and seriously limiting scalability of this application on multicore architectures.
In addition to this, the application exhibits irregular memory access patterns suggesting that the hardware prefetcher will have trouble requesting data in advance. Thus, a large number of the memory accesses may cause the processor to come to a complete stop while waiting for memory transfers to complete.
What needs to be done?
If data can be packed tighter, if algorithms and data structures can be changed to access data more regularly, and if data can be organized to help the hardware prefetcher, then this application would run faster and scale much better on a wide range of multicore systems.
It would be worth while to try other data sets to ensure that performance doesn't deteriorate with a larger working set.
|
Next Steps
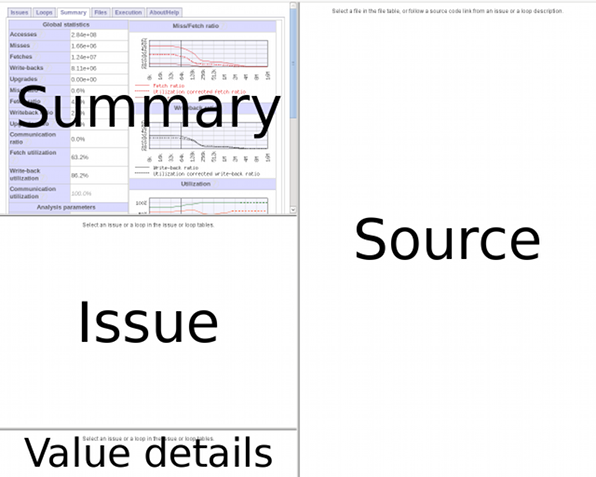
The prepared report is divided into sections.
-
Select the tab
Summary
to see global statistics for the entire application.
- Select the tabs Bandwidth Issues, Latency Issues and MT Issues to browse through the detected problems.
-
Select the tab
Loops
to browse through statistics and detected problems loop by loop.
The Issue and Source windows contain details and annotated source code for the detected problems.
Resources
Manual
ParaTools Web Site
|