| 2.1. Using the Graphical User Interface | ||
|---|---|---|
 | Chapter 2. Running Freja |  |
| 2.1. Using the Graphical User Interface | ||
|---|---|---|
| | Chapter 2. Running Freja | |
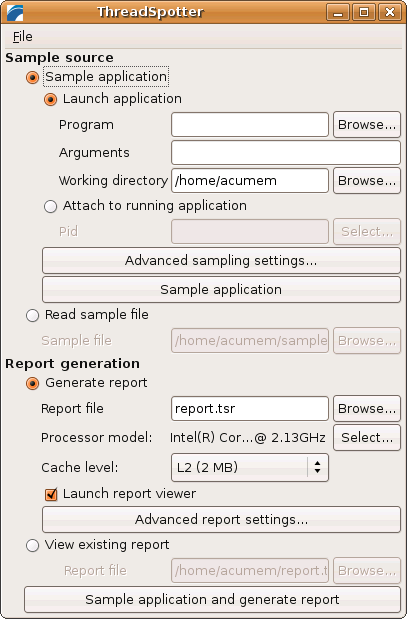
The graphical user interface provides an easy way to sample applications and generate reports. It is started from the menu of your window manager, or using the internal command from the Freja package, usually installed as /opt/freja/bin/internal:
$ internal
There are three basic tasks you can perform from the graphical user interface:
Sample an application and save the collected information in a sample file.
Generate a report file from a sample file.
View a report file.
You can also perform any combination of these the tasks at once, for example, launch and sample an application, generate a report and view the generated report in one go.
Sampling an application and saving the collected data to a sample file is useful if you want to generate multiple reports based on the same application run, for example, if you want generate reports for several different cache configurations for the same application.
First you need to select a name for the sample file. Click the button. In the dialog window that opens, check the box and enter a file name.
In this window you can also make some other choices about how to sample the application, see Section 2.1.5, “Advanced Sampling Settings” for more information.
There are two ways to sample an application:
Launching and sampling an application.
The application to be sampled is launched by Freja and sampled. By default the application is sampled until it terminates. If you choose to stop the sampling before the application is finished the application is automatically terminated.
Sampling a running application.
Freja attaches to a running application and samples it. When the sampling is finished Freja detaches and the application continues running normally.
Note that when launching an application the sampler does not sample other processes started by the specified application. This means that if you want to sample an application that is usually started through a script or by a different application, you have to check what command the script or application uses to start the application and manually specify that command. If you specify the script, only the script itself will be sampled, not the intended application.
This also applies when you attach to a running application that in turn starts other processes.
Select as sample source. Fill in the application to be sampled in the Program field and the arguments to the application in the Arguments field. For example, if you want to sample the command ls -l -a, fill in ls in the Program field and -l -a in the Arguments field.
When you are done click the button. When the sampling starts an xterm containing the sampled application will pop up.
The application will be sampled until the it terminates, or until the sampling stop condition is met if you have specified one, see Section 2.1.5, “Advanced Sampling Settings”. When the sampling has finished the sample file will be post-processed for a short while.
The terminal has to be closed manually when the process has terminated and the post-processing of the sample file has finished. This allows you to review any output from the sampled application and the sampling process.
Freja is also capable of sampling a running application. It will attach to it without the need to restart the application. When the sampling is done, it can detach from the application, leaving it running as before.
To sample a running application, select as sample source. Fill in the PID field with the process id of the process to be sampled if you know it, or click the button to select the process from a list.
When the sampling starts an xterm will pop up showing the sampler prompt. Enter the q command to stop sampling. When the sampling has finished the sample file will be post-processed for a short while.
The terminal has to be closed manually when the process has terminated and the post-processing of the sample file has finished. This allows you to review any output from the sampling process.
Sometimes the sampler will not be able to detach from the process immediately when requested to stop sampling. This happens if a sampled thread is waiting in a system call. If this happens you can try to "activate" the application to get the thread to finish the system call, for example, if the application has a command line interface and is waiting for user input, entering a command may help.
If that does not help, you can force a detach by giving the sampler the q command one more time. Doing this will cause a small memory leak in the sampled process, but that will usually not cause any problems.
In very rare cases it may not be possibly to stop the sampling without corrupting the sampled application. You will get a warning if that is the case.
To generate a report based on an existing sample file, change the sample source setting to .
You can then select the report file name and a processor model and cache level to do the analysis for in the Report generation part of the window.
By default the report is created in the current working directory and
named report.tsr.
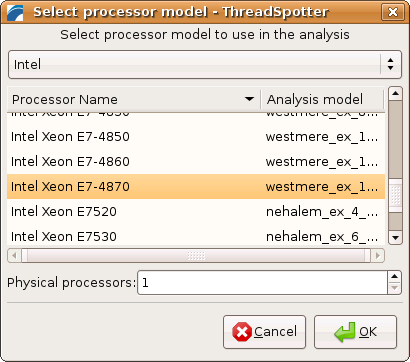
The advice in the report depends on the selected processor model and cache level. Some data structures or code sections may, for example, work well with a large cache but have problems with another processor model with a smaller cache, or they may work well in the L2 cache but have problems in the smaller L1 cache. To get relevant advice for your application and hardware, you have to specify a processor model that matches the processor you want to optimize for.
By default the processor model of the computer you are running on is selected. To change the processor model click the button to the right of the model name.
The processor model contains information about several aspects of the cache hierarchy, for example cache sharing and active prefetch instructions. If the intended model is not available, you may use a similar processor from the same product family. You may need to override parts of the processor model to get something that suits the target processor.
Model parameters and additional analysis parameters may be changed if you click the button. See Section 2.1.6, “Advanced Report Settings”.
To start the report generation click the button. When the report has been generated it is automatically opened in your web browser.
To sample an application and generate a report in one go, first configure the sampling as described in Section 2.1.1, “Sampling an Application”. You do not need to specify a sample file name unless you want to keep the sample file. Then configure the report generation as described in Section 2.1.2, “Generating a Report from a Sample File”, but without changing the sample source to . Finally, click the button.
To view an existing report, select the option in the Report generation section, select the report file, and then click the button.
Clicking the
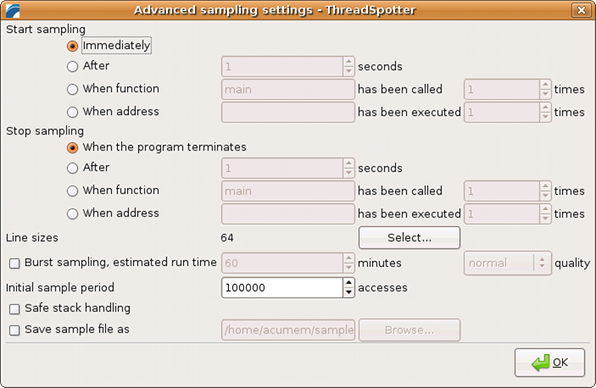
button in the main window opens a window with some additional settings
for sampling the application.
By default the sampler starts sampling the application immediately after it has launched or attached to it. Here you can choose to instead start sampling after a fixed delay or when a function or address has been executed a number of times. See Section 2.4.2, “Sampling Start Conditions” for more information.
By default the sampler will sample the application until it terminates or the user manually stops the sampling. Here you can choose to instead stop sampling after a fixed delay or when a function or address has been executed a number of times. See Section 2.4.3, “Sampling Stop Conditions” for more information.
Use this option if you want to generate a report for a cache line size other than the default. The line size selected for analysis is automatically selected and can not be unselected.
Use this option to enable burst sampling in order to reduce the sampling overhead for sampling runs that take at least 5 minutes. When enabled, you also need to enter an estimated execution time without sampling for the part of the application that you intend to sample. See Section 2.4.1, “Burst Sampling” for more information about burst sampling.
Use this setting if you get a message that you need to decrease the sample period during post-processing of the sample file. See Section 4.13, “Sample Period” for more information.
If you experience incorrect execution or crashes in the sampled program try enabling this option, see Section 2.4.4.2, “Disabling Application Stack Use by the Sampler”.
Sample files are normally not saved when sampling and generating a report in one go. Use this option if you want to save the sample file so that you can generate more reports from it later, or if you are sampling an application without generating a report.
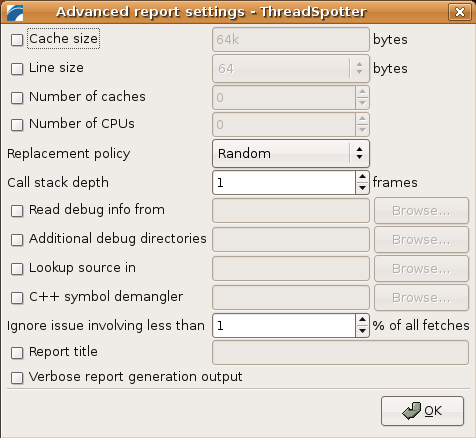
Clicking the
button in the main window opens a window with some additional
settings for the report generation.
Overrides the cache size selected by the processor model. You can use the suffixes k, m and g for kilobytes, megabytes and gigabytes, respectively, when specifying the cache size. For example, 64k for a 64 kilobyte cache.
Overrides the cache line size selected by the processor model. The selected line size will automatically be added to the list of line sizes to sample.
Overrides the number of caches on the selected cache level. Observed threads will be assumed to be mapped onto this number of caches.
Overrides the number of CPU sockets. This sets the number of assumed caches on the selected cache level in accordance with the current CPU model. Observed threads will be assumed to be mapped onto this number of caches.
This is an alternative to the option of specifying the number of caches.
Selects random replacement or LRU replacement as cache replacement policy for the analysis. Random replacement is the default.
This tells the analysis how many call stack levels to consider when separating issues in functions called from multiple places based on where the function was called from. See Section 4.12, “Call Stack”.
Use this option to specify the location of the sampled binary if it has been moved from the location it resided in during the sampling.
Look up source code in a user defined directory. Specify the new location of the source code if it has been moved since the application was compiled.
C++ symbol names normally appear mangled, particularly when using the stabs debug format. The compiler is usually accompanied with a program to render symbols in a human readable format. The default name for this program is c++filt. Specify the name of the program to use as a filter, or check the box and leave empty for the default name.
Do not report issues involving less than this percentage of the total fetches, upgrades or write-backs.
Set a custom report title.
If selected, a window showing the output from the report generator will be opened. Useful when looking for problems with report generation, for example, if the report generator fails to find source code.
The internal tool will try to start the default
browser on the system. If you wish to view the report in another
browser, or if the tool fails to find a browser, you can set
the BROWSER environment variable to the browser that
should be used. For example, if you are using
the bash shell and want to use
the google-chrome browser, you can use this
command before starting the tool:
$ export BROWSER=google-chrome
Freja has been verified to work with Internet Explorer, Firefox and Google Chrome. If you are using a different browser and experience problems viewing the report, try using one of the supported browsers instead.
The Firefox browser, and possibly other Gecko-based browsers, have a default behaviour when used on multiple computers in an X environment that is confusing, and that does not work well with the internal tool.
When you start a Firefox process and specify a URL to open, the process will by default look for other Firefox processes running in the same X server, and if one is found open the URL in that process's window even if that process is running on a different computer.
This does not work with the internal tool for a couple of reasons. The URL used to connect to the report web server (see Section 2.2.3, “Viewing a Report” for more information about the web server) uses the address localhost to refer to the web server, so if the report is opened on a another computer the URL will refer to the wrong computer. Also, since the report web server only accepts connections from the computer it is running on, Firefox would not be able to open the report from another computer even if it managed to resolve the URL to the correct computer.
The easiest way to avoid this problem is to set
the MOZ_NO_REMOTE environment variable to 1 before you
run the internal tool. For example, if you are
using the bash shell, you can use this command:
$ export MOZ_NO_REMOTE=1
This forces Firefox to start a new process on the computer where the command is run, even if there are already Firefox processes running on other computers. However, it will also prevent you from launching multiple browsers viewing the same report on the same computer, so you will have to close the report you are viewing before you can open another report on the same computer.
| |  | |
| Chapter 2. Running Freja |  | 2.2. Using the Command Line Tools |