| 7.1. Statistics | ||
|---|---|---|
 | Chapter 7. Reading the Report |  |
| 7.1. Statistics | ||
|---|---|---|
| | Chapter 7. Reading the Report | |
In the report you will find statistics sections in lots of places. There is a summary statistics section for the entire application, and there are smaller statistics sections for issues, loops and instruction groups.
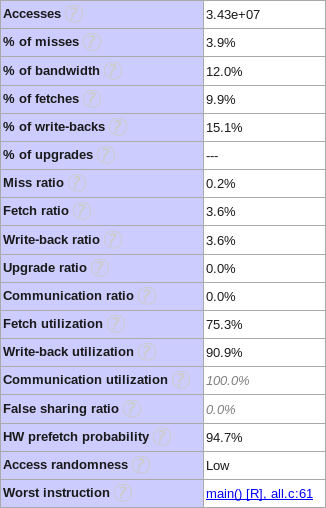
A statistics section consists of two parts, some statistics in numerical form and two diagrams. The diagrams plot some statistics for different cache sizes while the numerical statistics provide the exact values for the cache size the report focuses on.
The number of available fields in most statistics sections depends on how the input data was sampled. Absolute values, for example accesses and misses, are unavailable when analyzing burst sampled data. Also, note that the absolute values only apply to the sampled region when attach/detach is used.
ThreadSpotter™ is compatible with SlowSpotter™, however some statistics can not be generated when analyzing sample files created with SlowSpotter™. The most obvious difference is that all statistics related to communication will be disabled for such files. Other differences include, but are not limited to, fetch and write-back utilization and prefetch handling.
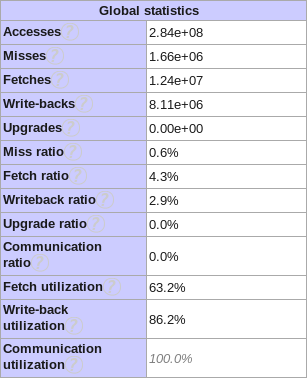
The summary section, issues and loops all contain numerical statistics. The fields shown in statistics sections in different parts of the report differ somewhat, but there is a large overlap.
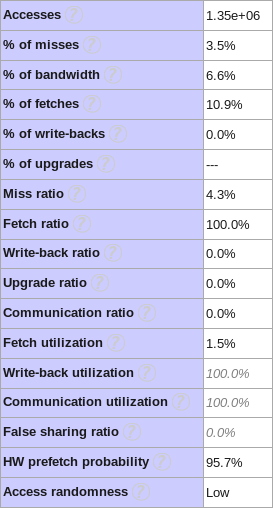
The value in some of the statistics fields may become gray and italic to indicate that it has a weak statistical base. This usually happens because the instruction group only has an insignificant amount of fetches.
The total number of memory accesses performed by the entire application, or a specific part of the application when not shown in the summary view. This value is calculated for the duration of the sampling and only corresponds to the total number of accesses performed by the application if the application was sampled from start to end.
This value is not available for burst sampled applications.
The total number of cache misses caused by the application during the sampling, see Section 3.4, “Cache Misses”.
This value is not available for burst sampled applications.
The total number of cache fetches caused by the application during the sampling, including those originating from hardware or software prefetches. See Section 3.8, “Fetch Ratio”.
This value is not available for burst sampled applications.
The total number of write-backs caused by the application during sampling.
The total number of cache line upgrades caused by the application during the sampling. See Section 3.9, “Upgrade Ratio”.
This value is not available for burst sampled applications.
The cache miss ratio of the entire application, see Section 3.4, “Cache Misses”.
The cache line fetch ratio of the entire application when displayed in the summary view, or for the specific part of the program when displayed in an issue, loop or instruction group statistics section. Includes fetches originating from hardware or software prefetches. See Section 3.8, “Fetch Ratio”.
The likelihood that a write instruction causes a cache line to be written back to memory. See Section 3.10, “Write-Back Ratio”
The upgrade ratio of the entire application when displayed in the summary view, or for the specific part of the program when displayed in an issue, loop or instruction group statistics section. See Section 3.9, “Upgrade Ratio”.
The fraction of memory accesses that cause communication between caches. See Section 3.7, “Multithreading and Cache Coherence”
Fraction of a cache line that is touched (read or written) before the cache line is evicted.
This value is shown instead of the separate fetch and write-back utilization values when analyzing sample files produced by old versions of SlowSpotter™.
The average fraction of each cache line fetched from memory or the next cache level that is actually read before the cache line is evicted from the cache. See Section 4.5, “Fetch Utilization”.
The average fraction of each cache line written back to memory or the next cache level that has actually been written by the time it gets written back. See Section 4.6, “Write-Back Utilization”
The average fraction of each cache line communicated from one cache to another cache at the same level that is actually read in the receiving cache before it is evicted. See Section 4.7, “Communication Utilization”
The cpu model that the report focuses on. The cpu model tells how many and how large caches there are, how many cores there are and how they share caches on various levels, how prefetch instructions work and how the non-temporal write instructions work.
The number of CPUs assumed for this analys.
The number of caches in the system on the selected cache level. Application threads are considered to populate this many caches.
Note, this is not the total number of caches in the system.
The cache level this report focuses on. This setting interacts with the cpu selection with respect to prefetch analysis, as depending on the cpu model, not all cache levels are affected by prefetch instructions.
The cache size the report focuses on in bytes. This can be the actual size (default), or it can be overridden. See Section 3.2, “Cache Lines and Cache Size”.
The cache line size the report focuses on in bytes. This can be the actual size (default), or it can be overridden. See Section 3.2, “Cache Lines and Cache Size”.
The cache replacement policy the report focuses on. See Section 3.3, “Replacement Policies”.
Indicates whether the effects of software prefetches are visible on this cache level.
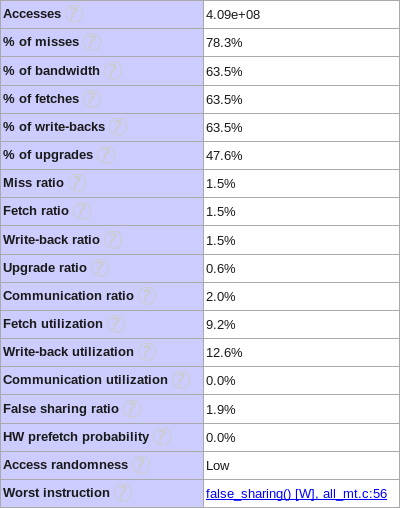
The fraction of the total number of cache misses of the application that are caused by the selected issue, loop or instruction group.
The fraction of the total bandwidth requirement of the application, that is caused by the selected issue, loop or instruction group.
The fraction of the total number of cache line fetches of the application, including those originating from hardware or software prefetches, that are caused by the selected issue, loop or instruction group.
The fraction of the total number of write-backs of the application that are caused by the selected issue, loop or instruction group.
The fraction of the total number of cache line upgrades of the application that are caused by the selected issue, loop or instruction group.
The likelihood that an access causes a cache line to be communicated between two caches without actually sharing any data between the two threads. This is related to the communication ratio, but only includes useless communication. See Section 5.4.1, “False Sharing”
This value is not available when analyzing sample files produced by SlowSpotter™.
An estimate of the fraction of the cache misses that are avoided by the hardware prefetcher, assuming that the memory bandwidth limit is not hit. See Section 3.6.2, “Hardware Prefetching”.
An estimate of randomness of the memory access pattern of this part of the application. Random access patterns are generally harmful to performance, see Section 4.11, “Access Randomness”.
Points out the instruction that causes causes the largest number of cache line fetches in this part of the program, and the source code line that generated it.
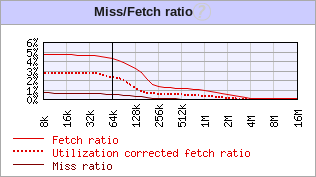
The report contains diagrams describing several cache size dependent application characteristics. The summary tab in the summary frame shows application global values, while the individual issues and loops show values related to their respective instruction groups.
The diagrams plot their values for different cache sizes, from an 8 kilobyte cache to a 16 megabyte cache in the following example. The cache size that the report focuses on is marked with a vertical black line, in this case at 64 kilobytes.
Bright red line
Fetch ratio, the ratio of memory operations in the program, loop, issue or instruction group that, directly or indirectly through hardware prefetching, cause a data transfer between memory and cache. See Section 3.8, “Fetch Ratio”.
Red dotted line
Utilization corrected fetch ratio. Fetch ratio if the fetch utilization was raised to 100%. See Section 4.8, “Utilization Corrected Fetch Ratio”.
Dark red line
Miss ratio, the ratio of memory operations in the program that stall due to cache misses. The difference between the fetch ratio and the miss ratio is caused be software and hardware prefetching. See Section 3.4, “Cache Misses”.
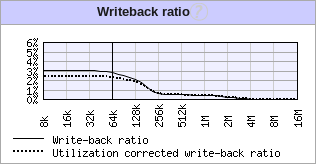
Black line
Write-back ratio, the ratio of memory accesses that cause a cache line to be written back to memory. See Section 3.10, “Write-Back Ratio”.
Black dotted line
Utilization corrected write-back ratio, the ratio of memory accesses that would cause a write-back if the write-back utilization was raised to 100%. See Section 4.9, “Utilization Corrected Write-Back Ratio”.
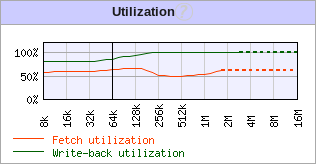
Blue line
Cache line utilization for the program, loop, issue or instruction group. Shows how large fraction of the data that is loaded into the cache is actually used by read or write operations.
This line is shown instead of a separate fetch and write-back utilization when analyzing files produced by old versions of SlowSpotter™.
Orange line
Fetch utilization of the program, loop, issue or instruction group. Shows how large fraction of the data that is loaded into the cache is actually read. The utilization curve is dashed beyond the point where the estimates have a weak statistical base. See Section 4.5, “Fetch Utilization”.
Green line
Write-back utilization of the program, loop, issue or instruction group. Shows how large fraction of a cache line that is written prior to writing the line to memory. The utilization curve is dashed beyond the point where the estimates have a weak statistical base. See Section 4.6, “Write-Back Utilization”.
| |  | |
| Chapter 7. Reading the Report |  | 7.2. The Report Layout |