| 7.5. The Source Code Frame | ||
|---|---|---|
 | Chapter 7. Reading the Report |  |
| 7.5. The Source Code Frame | ||
|---|---|---|
| | Chapter 7. Reading the Report | |
The frame to the right in the report displays the source code of the application.
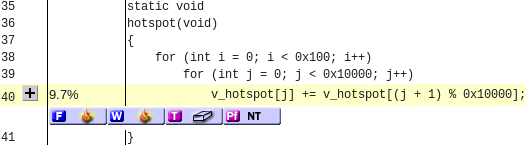
Clicking on a source code line reference or on a file name in the Files tab opens a new page in the source code frame. As can be seen in Figure 7.23, “Source Code with Collapsed Lines”, the source code is annotated. There are three columns showing the line number, the percentage of all the cache line fetches of the application directly or indirectly caused by the line, and the source code itself.
Lines that significantly affect the memory behavior are highlighted in yellow and the line number column of each line in the currently selected loop is highlighted in purple. Each significant line also has a set of icons representing the issues it is causing, and there is and expand button you can click to show more information about the line.
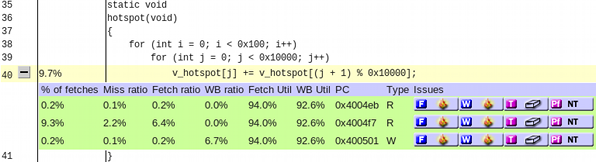
Clicking on the expand button shows more information about each significant machine code instructions belonging to the line, as seen in Figure 7.24, “Source Code with Expanded Lines”. If the function is called from different places and Freja separates the different call stacks, the statistics for each instruction is display separate for each call stack, and the different call stacks are shown in alternating green shades.
The statistics shown for each instruction are:
Percentage of all cache line fetches of the application caused by the instruction.
The cache miss ratio of the instruction.
Note that the miss ratios of prefetch instructions are displayed here. Misses caused by prefetch instructions are not included in the statistics of instruction groups, loops or the entire application, because unlike other cache misses prefetches that miss in the cache do not cause stalls. See Section 3.4, “Cache Misses” for more information.
The fetch and write-back utilization of the instruction.
The address of the instruction.
The access type of the instruction; read and/or write, or prefetch.
Icons for the issues that the instruction is involved in.
| |  | |
| 7.4. The Issue Frame |  | Chapter 8. Issue Reference |