| 7.3. The Summary Frame | ||
|---|---|---|
 | Chapter 7. Reading the Report |  |
| 7.3. The Summary Frame | ||
|---|---|---|
| | Chapter 7. Reading the Report | |
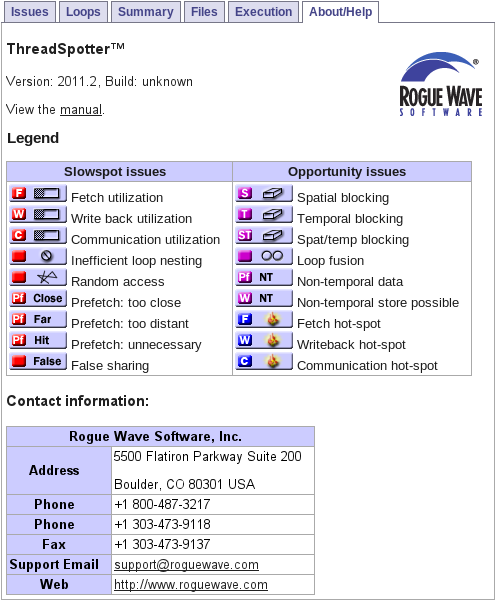
The summary frame contains different views which can be chosen by clicking on their respective tab.
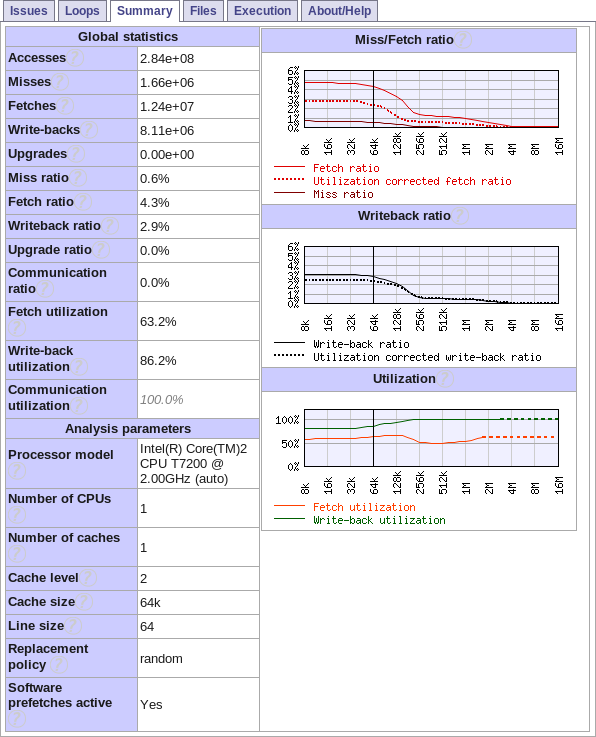
The summary tab presents statistics for the entire application and information about the parameters used in the analysis.
The diagrams show various cache size dependent metrics for the whole application. See Section 7.1.2, “Reading the Diagrams”.
The table below the diagram shows the values of some statistics for the entire application at the specific cache size the analysis focuses on and the values of some parameters used in the analysis, see Section 7.1.1, “Reading the Statistics”
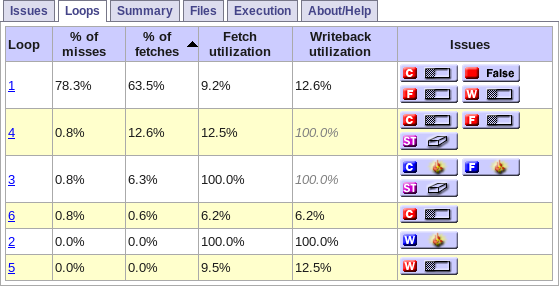
The loops tab enumerates the loops associated with issues that have been found in the application and some statistics about them. Sometimes the same loop may be the cause of several issues and it may then be a good take an over all look at the loop instead of looking at each of the issues separately.
Numerical identifier for the current loop. Clicking on this number will bring up information about the loop in the issue frame, see Section 7.4.4, “Issue Details”. It will also highlight the instructions related to the loop in the source frame.
The proportion of the total cache misses that are caused by the loop.
The proportion of the total cache fetches that are caused by the loop.
Loops are sorted by this value by default.
Average fetch utilization for the instructions involved in this loop. See Section 4.5, “Fetch Utilization”.
Average write-back utilization for the instructions in this loop. See Section 4.6, “Write-Back Utilization”
Icons symbolizing the issues associated with this loop.
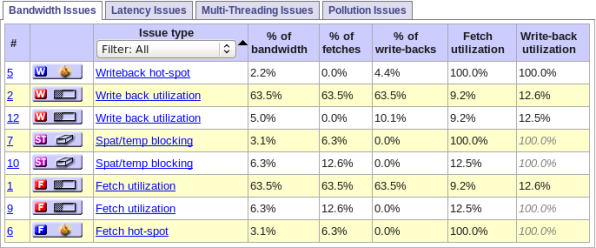
The bandwidth issues tab lists the issues that primarily affect the memory bandwidth requirement of the application. These are issues that may be hidden by hardware prefetching as long as there is enough memory bandwidth available, but will start to cause cache misses if the memory bandwidth is exhausted.
The following columns are available in the bandwidth issue list:
Numerical identifier for the current issue. Clicking on this number will bring up information about the issue in the issue frame, see Section 7.4.4, “Issue Details”. It will also bring up the related source code in the source frame, and highlight the worst line.
Issue type and icon. The issue icon is also shown in the source frame.
The proportion of the total fetches and write-backs that are caused by the issue. This gives you an idea of which issues cause the most memory-bandwidth usage and therefore are most important to address.
Bandwidth issues are sorted by this value by default.
The percentage of the total cache line fetches that are related to the issue.
The percentage of the total cache line write-backs that are related to the issue.
Average fetch utilization for the instructions involved in this issue. See Section 4.5, “Fetch Utilization”.
Average write-back utilization for the instructions involved in this issue. See Section 4.6, “Write-Back Utilization”
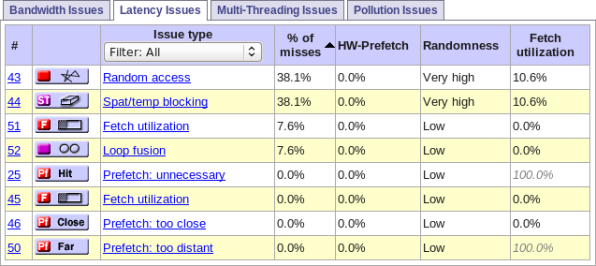
The latency issues tab lists the issues that primarily cause cache misses. Cache misses cause stalls in the execution and have an immediate negative effect on the execution speed.
The following columns are available in the latency issue list:
Numerical identifier for the current issue. Clicking on this number will bring up information about the issue in the issue frame, see Section 7.4.4, “Issue Details”. It will also bring up the related source code in the source frame, and highlight the worst line.
Issue type and icon. The issue icon is also shown in the source frame.
The proportion of the total cache misses that are caused by the issue. This gives you an idea of which issues cause the most misses and therefore are most important to address.
Latency issues are sorted by this value by default.
An estimate of the fraction of the cache misses related to this issue that are avoided by the hardware prefetcher, assuming that the memory bandwidth limit is not hit. See Section 3.6.2, “Hardware Prefetching”.
An estimate of randomness of the memory access pattern for the instructions related to this issue. See Section 4.11, “Access Randomness”.
Average fetch utilization for the instructions involved in this issue. See Section 4.5, “Fetch Utilization”.
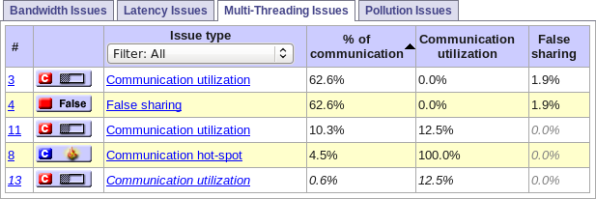
The multi-threading issues tab lists issues related to multithreading and data sharing between threads.
The following columns are available in the multi-threading issue list:
Numerical identifier for the current issue. Clicking on this number will bring up information about the issue in the issue frame, see Section 7.4.4, “Issue Details”. It will also bring up the source code for the related to the issue in the source frame.
Issue type and icon. The issue icon is also shown in the source frame.
The percentage of all cache line communication of the application that is associated with this issue.
The average communication utilization for the instructions involved an issue. See Section 4.7, “Communication Utilization”.
The probability that an access related to an issue will suffer from false sharing. See Section 5.4.1, “False Sharing”.
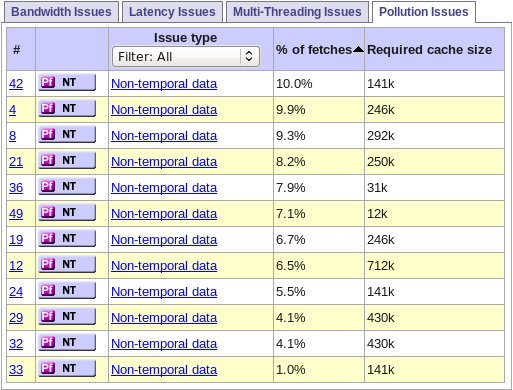
The pollution issues tab lists issues related to cache pollution and non-temporal data.
The following columns are available in the pollution issue list:
Numerical identifier for the current issue. Clicking on this number will bring up information about the issue in the issue frame, see Section 7.4.4, “Issue Details”. It will also bring up the source code for the related to the issue in the source frame.
Issue type and icon. The issue icon is also shown in the source frame.
The percentage of all fetches of the application that are caused by these non-temporal reuses.
An estimate of the cache size that would be required for the fetch ratio the non-temporal reuses to fall below 80%.
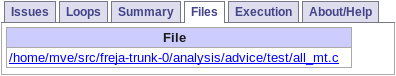
The files tab lists the source code files of the application. Clicking on a file opens it in the source code frame.
This tab also lists all loaded modules, binaries and shared libraries (.so, .dll), along with their respective load addresses. This table is useful to understanding code paths and call stack chains in third-party code, for which no debug information is available.
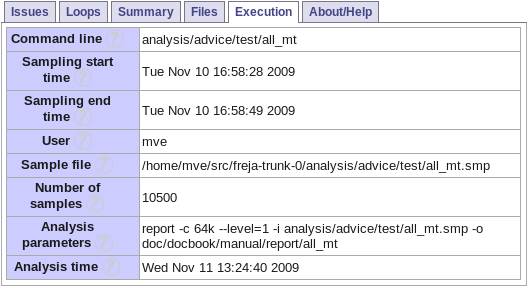
The execution tab shows some information about the sampling and analysis the report is based on.
The command line of the sampled application. Reported to make it easier to reproduce a run.
The time when the sampling of the application started.
The time when the sampling of the application ended.
The user account that was used when sampling the application.
The name of the sample file the report is based non.
The number of samples in the sample file.
The command line of the report command when generating the report. Provided to make it easier to repeat the same analysis.
The time when the report was generated.
A list of how the threads in the application populate the caches according to the thread binding currently in effect.
Cache number denotes the sibling number of the cache at the selected cache level.
Thread id is the operating thread id number. Depending on the active thread bindning, one or more threads can operate in each cache.
For each thread, Freja sequentially assigns a virtual thread id, starting with 0. It may be easier to use these virtual thread ids when specifying explicit thread bindings. See options --number-of-caches , --group and --real-thread-id in report(1).
Use this table to see the effect of different thread bindings.
| |  | |
| 7.2. The Report Layout |  | 7.4. The Issue Frame |