Difference between revisions of "ENZO"
(→Enzo Version 1.5) |
|||
| (36 intermediate revisions by 2 users not shown) | |||
| Line 1: | Line 1: | ||
=ENZO Performance Study Summary= | =ENZO Performance Study Summary= | ||
| − | This | + | This page shows the performance result from ENZO (svn repository version). We chose this version in part to see the effects of load balancing (not enabled in version 1.5) on scaling performance. The previous performance results for ENZO version 1 are [[EnzoV1Performance | here]]. |
| − | + | ==Enzo Version 1.5== | |
| − | |||
| − | + | Following the release of Enzo 1.5 in November '08 we have done some follow up performance studies. Our initial findings are similar to what we found for version 1.0.1. | |
| − | + | The configuration files used were like these: | |
| − | |||
| − | + | * [http://nic.uoregon.edu/~scottb/point.inits.large inits] | |
| − | + | * [http://nic.uoregon.edu/~scottb/point.param.large param] | |
| − | |||
| − | |||
| − | |||
| − | |||
| − | |||
| − | |||
| − | |||
| − | |||
| − | |||
| − | |||
| − | |||
| − | |||
| − | |||
| − | |||
| − | |||
| − | |||
| − | |||
| − | |||
| − | |||
| − | |||
| − | |||
| − | |||
| − | |||
| − | |||
| − | + | (The grid and particle sizes change between experiments). | |
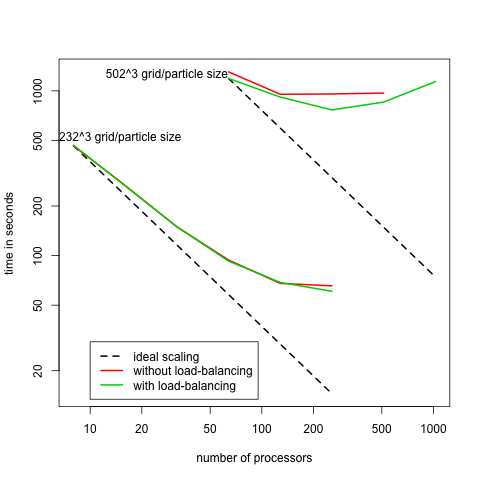
| − | + | This chart shows the scaling behavior of Enzo 1.5 on Kraken: | |
| − | [[Image: | + | [[Image:EnzoScalingKraken.png]] |
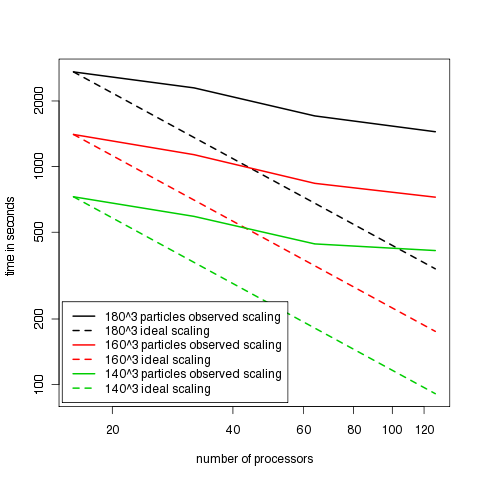
| − | + | Scaling behavior was very similar on Ranger: | |
| − | + | [[Image:EnzoScalingRanger.png]] | |
| − | + | This scaling behavior could be anticipated by looking at the runtime breakdown (mean of 64 processors on Ranger): | |
| − | + | [[Image:EnzoMeanBreakdown.png]] | |
| − | |||
| − | + | With this much time spent in MPI communication, increasing the number of processors allocated to more than 64 is unlikely to result in a much lower total execution time. Looking more closely at MPI_Recv and MPI_Barrier, we see that on average 5.2ms is spent per call in MPI_Recv and 40.4ms in MPI_Barrier. This is much longer than can be explained by communication latencies on Ranger's InfiniBand interconnect. Mostly likely ENZO is experiencing a load imbalance causing some processors to wait for others to enter the MPI_Barrier or MPI_Send. | |
| − | + | Next we looked at how enabling load balancing affects performance. This a runtime comparison between non-load balanced (blue) vs. load balanced simulation (red): | |
| − | |||
| − | + | [[Image:EnzoMeanComp.png]] | |
| − | |||
| − | |||
| − | |||
| − | + | Time spent MPI_Barrier decreased but was mostly offset by the increase in time spent in MPI_Recv. | |
| − | [[Image: | + | Callpath profiling gives us an idea where most of the costly MPI communications are taking place. |
| + | |||
| + | [[Image:EnzoCallpathMpiRecv.png]] | ||
| + | |||
| + | [[Image:EnzoCallpathMpiBarrier.png]] | ||
| + | |||
| + | MPI Barriers take place in EvolveLevel(). And MPI_Recv takes place in grid::CommunicationSendRegions(). | ||
| + | |||
| + | ==Snapshot profiles== | ||
| + | |||
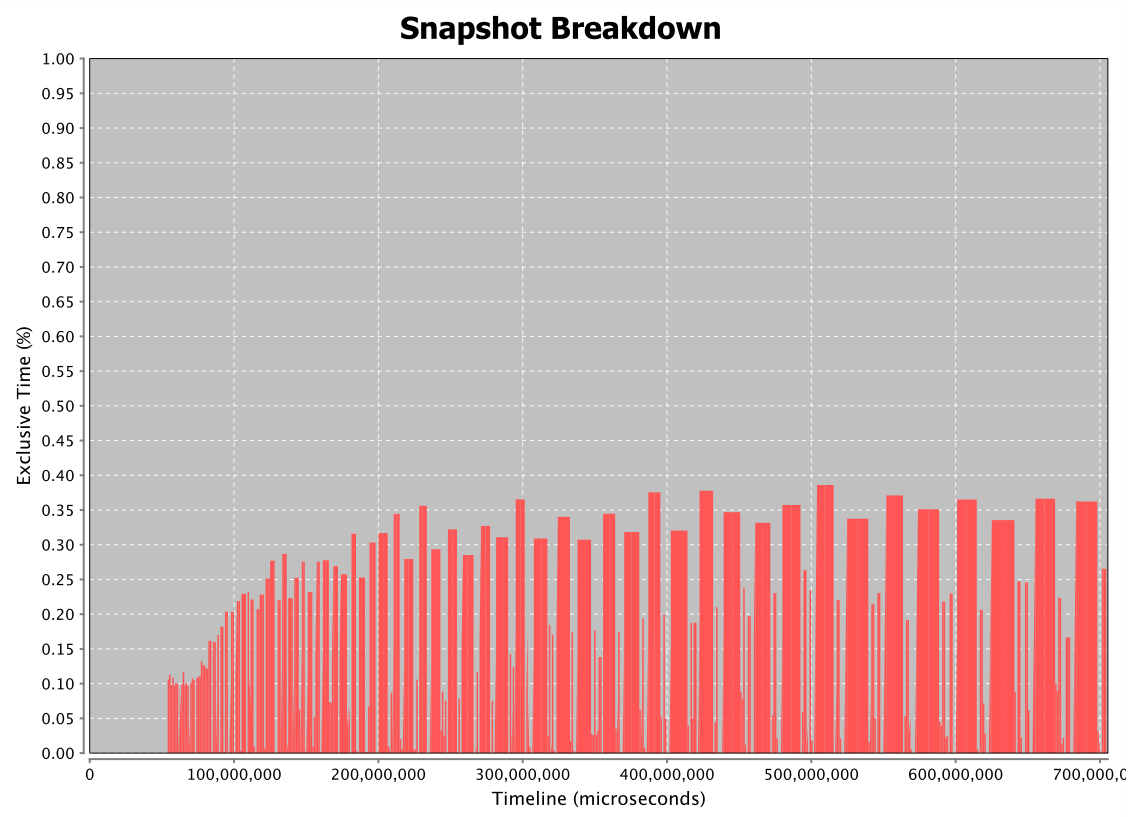
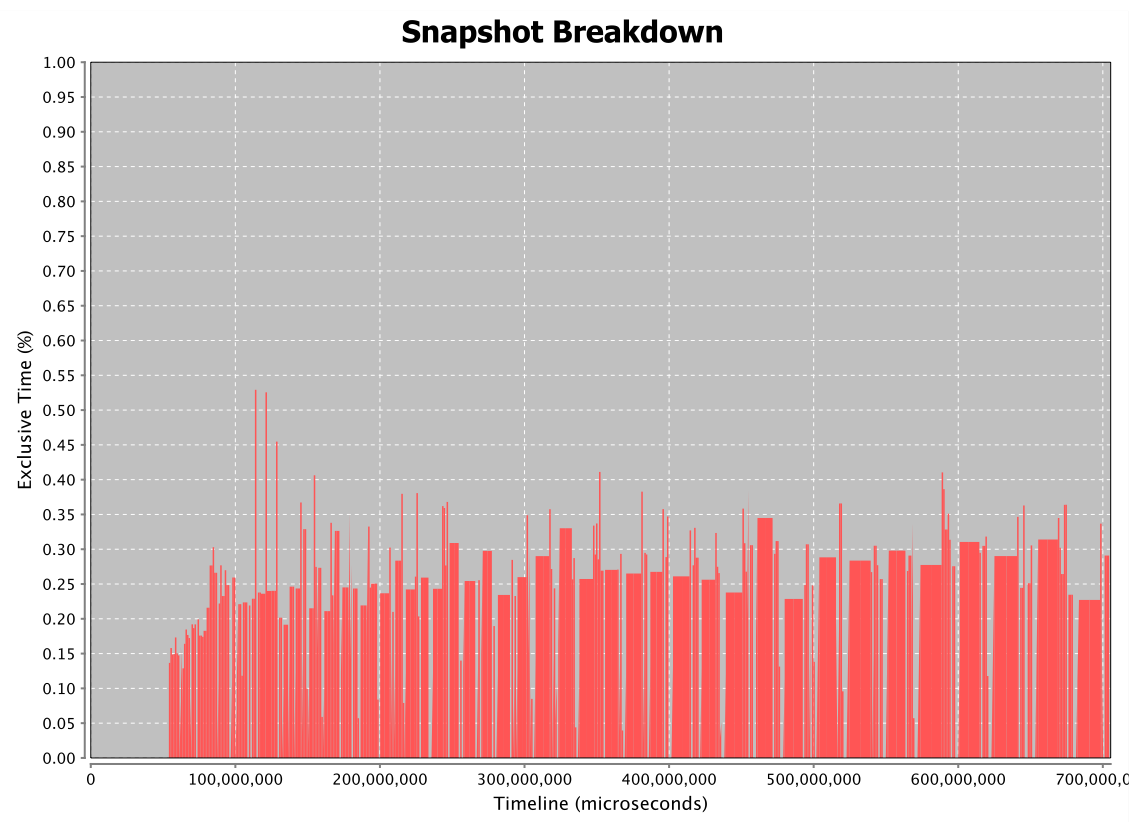
| + | Additionally, we used snapshot profiling to get a sense of how ENZO's performance changed over the course of the entire execution. A snapshot was taken at each load balancing step such that each bar represents a single phase of ENZO between two load balancing phases. The first thing to notice is that these phases are regular and short at the beginning of the simulation and become progressively more varied in length with some becoming much longer. | ||
| + | |||
| + | (The time spent before that first load balancing has been removed--mostly initialization) | ||
| + | |||
| + | For MPI_Recv: | ||
| + | [[Image:EnzoSnapMpiRecvPercent.png|600px]] | ||
| + | |||
| + | For MPI_Barrier: | ||
| + | [[Image:EnzoSnapMpiBarrierPercent.png|600px]] | ||
Latest revision as of 20:32, 14 July 2009
ENZO Performance Study Summary
This page shows the performance result from ENZO (svn repository version). We chose this version in part to see the effects of load balancing (not enabled in version 1.5) on scaling performance. The previous performance results for ENZO version 1 are here.
Enzo Version 1.5
Following the release of Enzo 1.5 in November '08 we have done some follow up performance studies. Our initial findings are similar to what we found for version 1.0.1.
The configuration files used were like these:
(The grid and particle sizes change between experiments).
This chart shows the scaling behavior of Enzo 1.5 on Kraken:
Scaling behavior was very similar on Ranger:
This scaling behavior could be anticipated by looking at the runtime breakdown (mean of 64 processors on Ranger):
With this much time spent in MPI communication, increasing the number of processors allocated to more than 64 is unlikely to result in a much lower total execution time. Looking more closely at MPI_Recv and MPI_Barrier, we see that on average 5.2ms is spent per call in MPI_Recv and 40.4ms in MPI_Barrier. This is much longer than can be explained by communication latencies on Ranger's InfiniBand interconnect. Mostly likely ENZO is experiencing a load imbalance causing some processors to wait for others to enter the MPI_Barrier or MPI_Send.
Next we looked at how enabling load balancing affects performance. This a runtime comparison between non-load balanced (blue) vs. load balanced simulation (red):
Time spent MPI_Barrier decreased but was mostly offset by the increase in time spent in MPI_Recv.
Callpath profiling gives us an idea where most of the costly MPI communications are taking place.
MPI Barriers take place in EvolveLevel(). And MPI_Recv takes place in grid::CommunicationSendRegions().
Snapshot profiles
Additionally, we used snapshot profiling to get a sense of how ENZO's performance changed over the course of the entire execution. A snapshot was taken at each load balancing step such that each bar represents a single phase of ENZO between two load balancing phases. The first thing to notice is that these phases are regular and short at the beginning of the simulation and become progressively more varied in length with some becoming much longer.
(The time spent before that first load balancing has been removed--mostly initialization)


