ENZO
Contents
ENZO Performance Study Summary
This is a short overview of the performance result from the ENZO application. For each experiment we used these inits/param files:
This is a relatively small experiment but was sufficient to generate some interesting performance results. For this study we used the TAU Performance System® to gather information about ENZO's performance, in particular we are interested in the performance of the AMR simulation at scale. We ran these experiments on NCSA's Intel 64 Linux Cluster (Abe).
TAU Measurement overhead
Here is a short table listing the run-times for various experiments and the instrumentation overhead observed. Each run was on 64 processors (8 nodes).
| Run Type | Runtime (seconds) | Overhead % |
|---|---|---|
| Uninstrumented runtime | 1072 | NA |
| Trace of only MPI event | 1085 | 4.8% |
| Profile of all significant events | 1136 | 6.0% |
| Profile with Call-path information | 1196 | 11.6% |
| Profile of each Phase of execution | 1208 | 12.7% |
Runtime Breakdown on 64 processors
Here is a chart showing the contribution each function makes to the overall runtime. Notice that MPI communication time takes over 60% of the total runtime.
Experiment Scalability
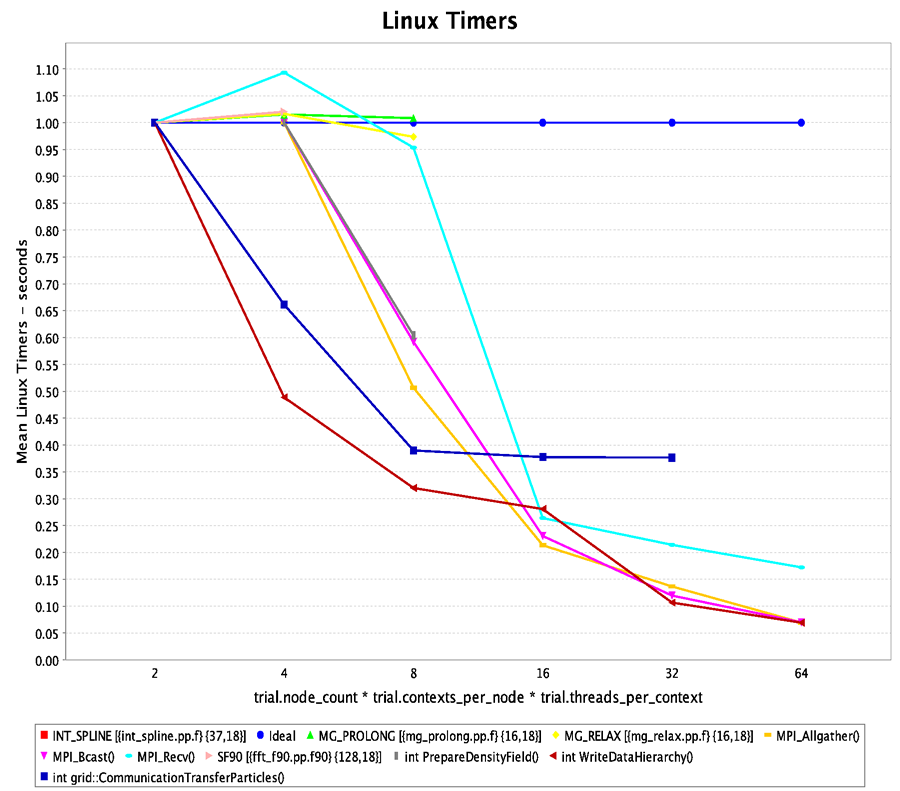
This chart shows that MPI communication time, like in the 64 processor case, continues to dominate the runtime--and to an even greater extent when a larger number of processors are involved.
Experiment Trace
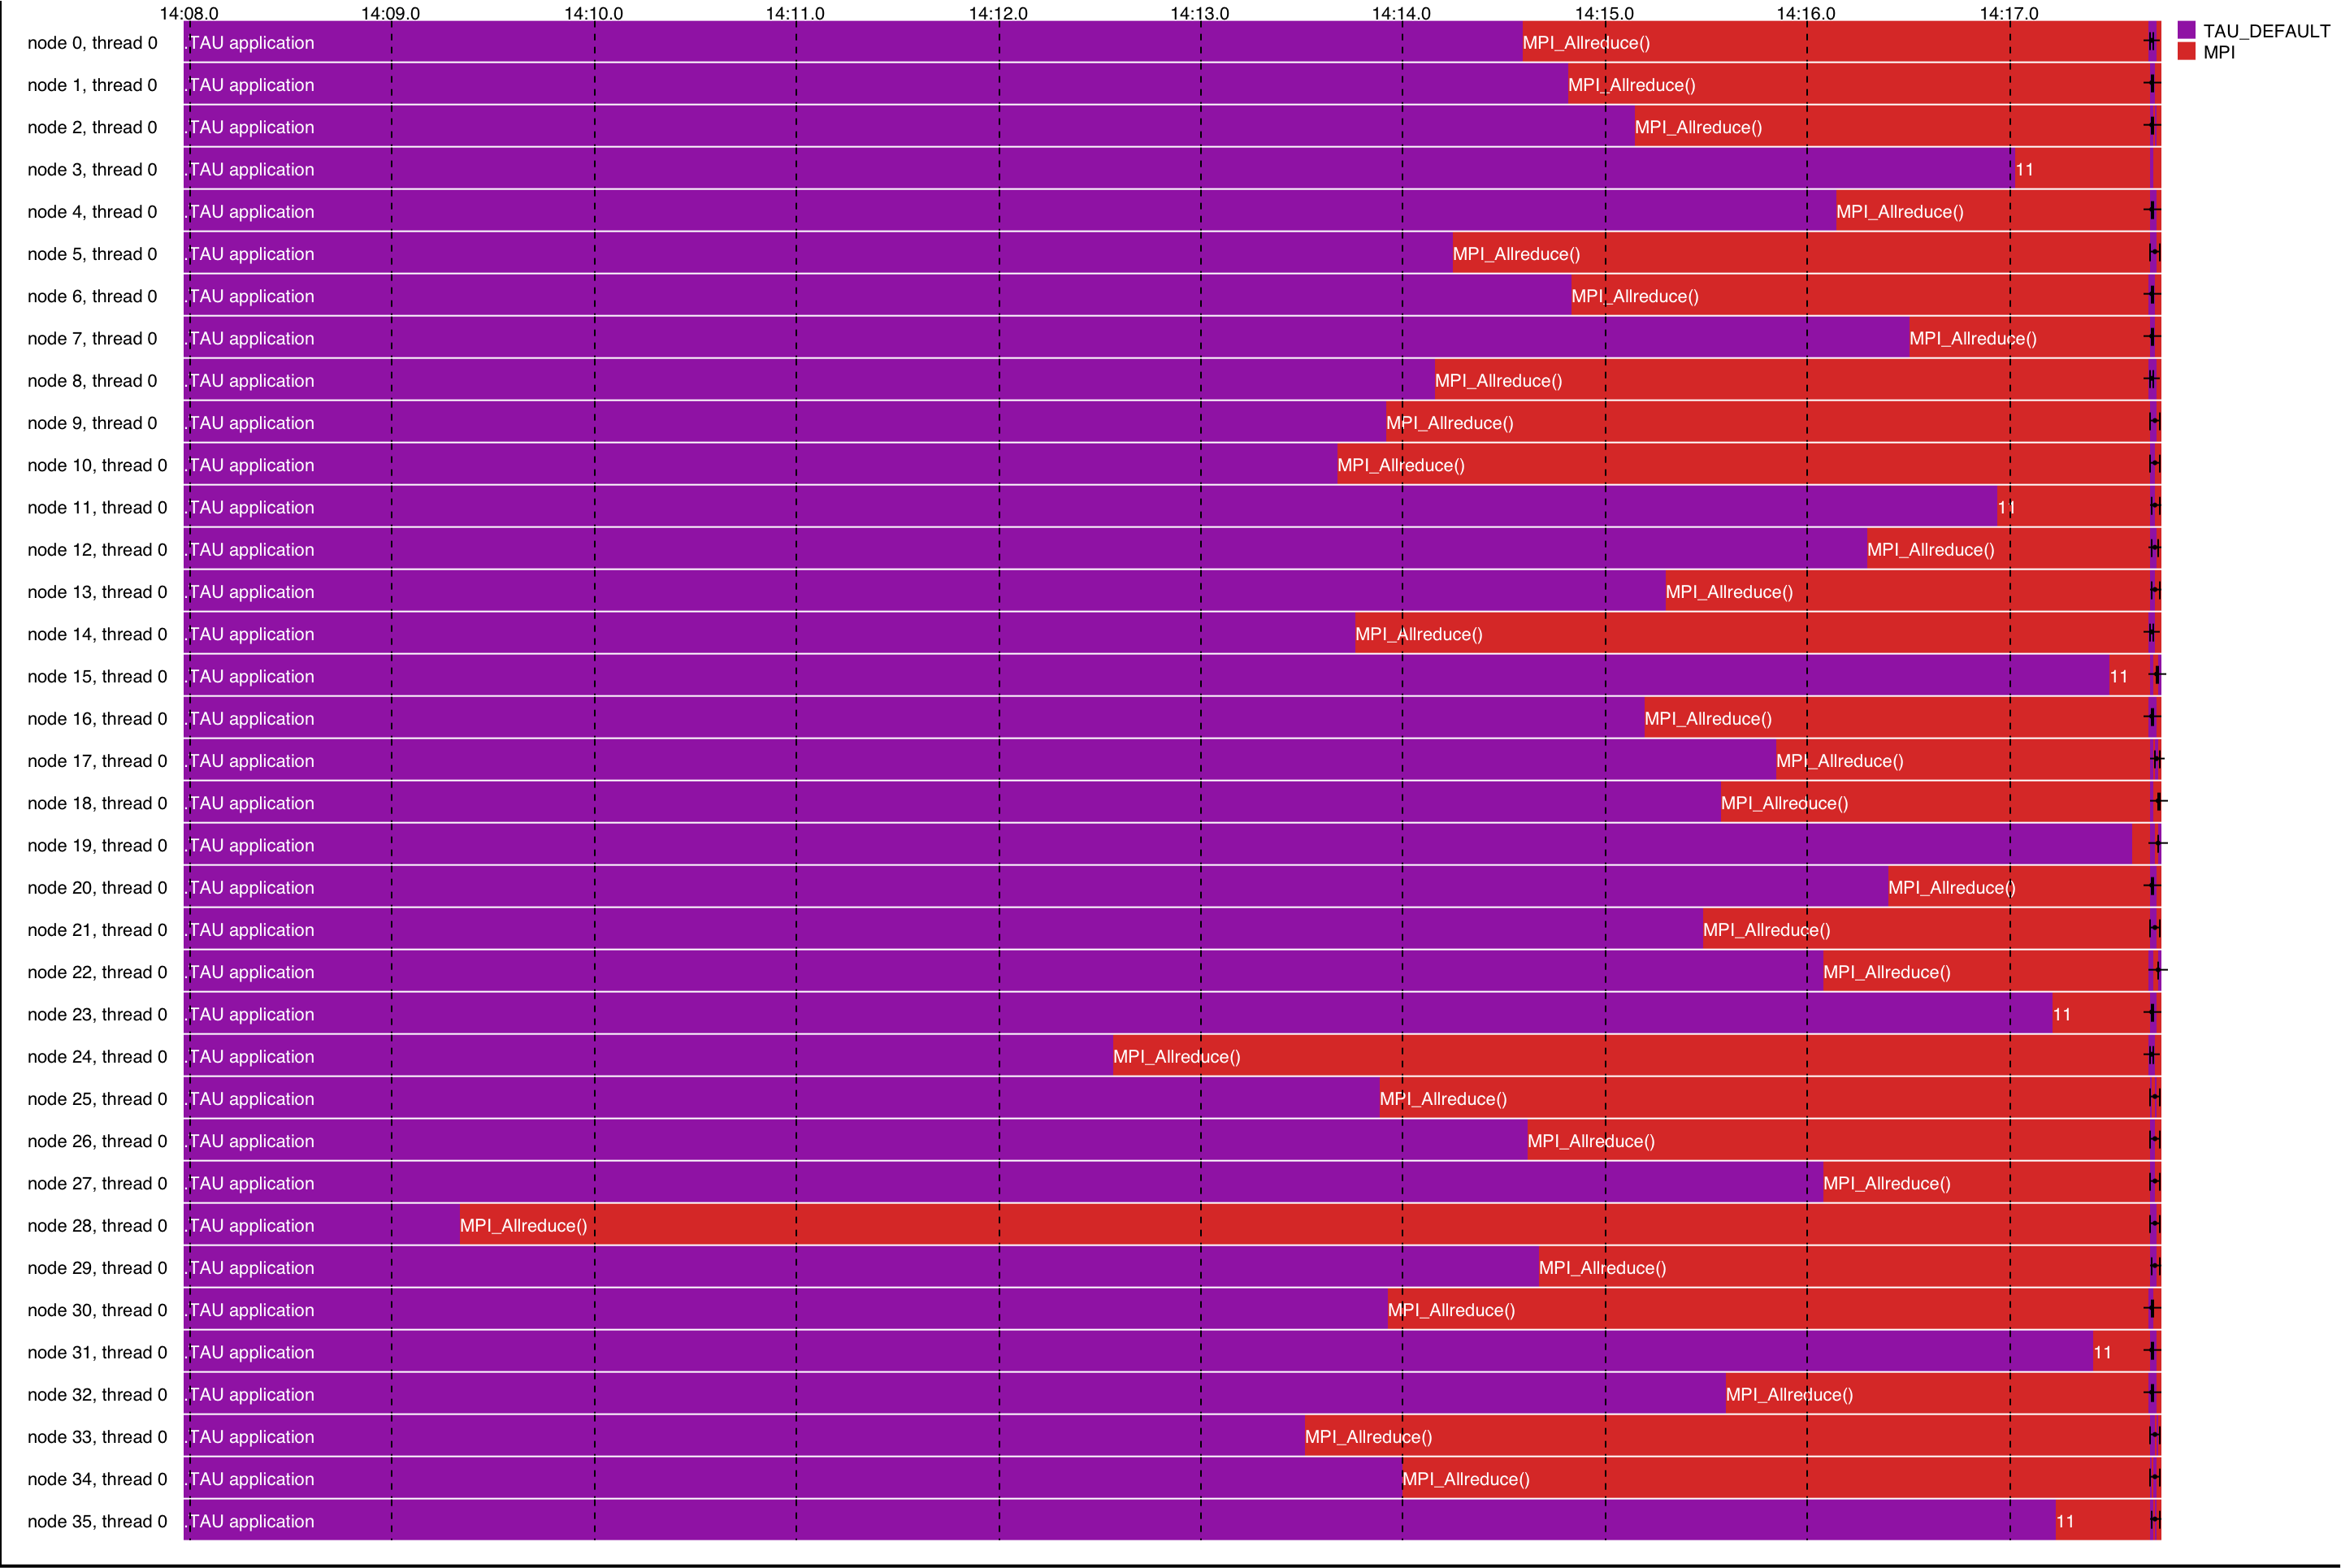
This graphic shows how load imbalances causes long wait times for MPI_Allreduce. Some processors are experiencing as much as 8 seconds of wait time per reduce.
Experiment Call-Paths
We observe the follow relationships in the experiment call-path:
- Almost all the time spend in MPI_Bcast is when it is called from MPI_Allreduce.
- Almost all the time spend in MPI_Recv is when it is called from grid::CommunicationSendRegion.
- Most all the time spend in MPI_Allgather is when it is called from CommunicationShareGrids.
- Almost all the time spend in MPI_Allreduce is when it is called from CommunicationMinValue.
This chart show the details:


