Difference between revisions of "NEMO3D"
(→Legend) |
(→Legend) |
||
| Line 25: | Line 25: | ||
<font color=black>Entire Experiment</font> <font color=red>Loop 1</font> <font color=green>Loop 2</font> | <font color=black>Entire Experiment</font> <font color=red>Loop 1</font> <font color=green>Loop 2</font> | ||
| − | [[Image:Nemo_plot_time.png| | + | [[Image:Nemo_plot_time.png|600px|left]] [[Image:Nemo_plot_fp.png|600px|left]] [[Image:Nemo_plot_dcm.png|600px|left]] |
Revision as of 19:50, 3 September 2008
This is a summary of the performance evaluation of NEMO3D. Our initial focus was on finding hot spots in the code where most of the computational work is being done. In all case the NEMO3D benchmark_lanc_thin_no_strain (262144) with recomputed matrices was used. Overhead was calculated on 16 processors.
Instrumentation overhead
| Run Type | Runtime (seconds) | Overhead % |
|---|---|---|
| Uninstrumented runtime | 372 | NA |
| Routine+loops instrumentation | 392 | 5.4 |
Significant Loops
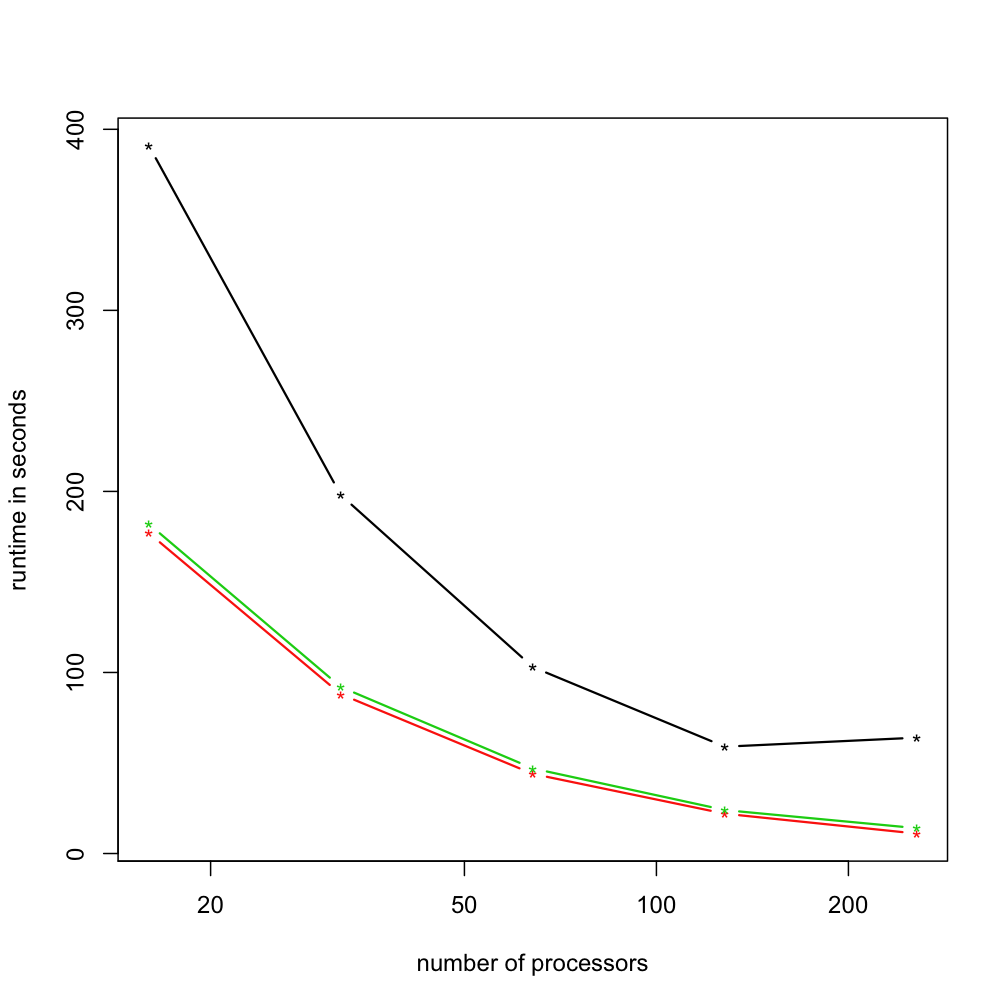
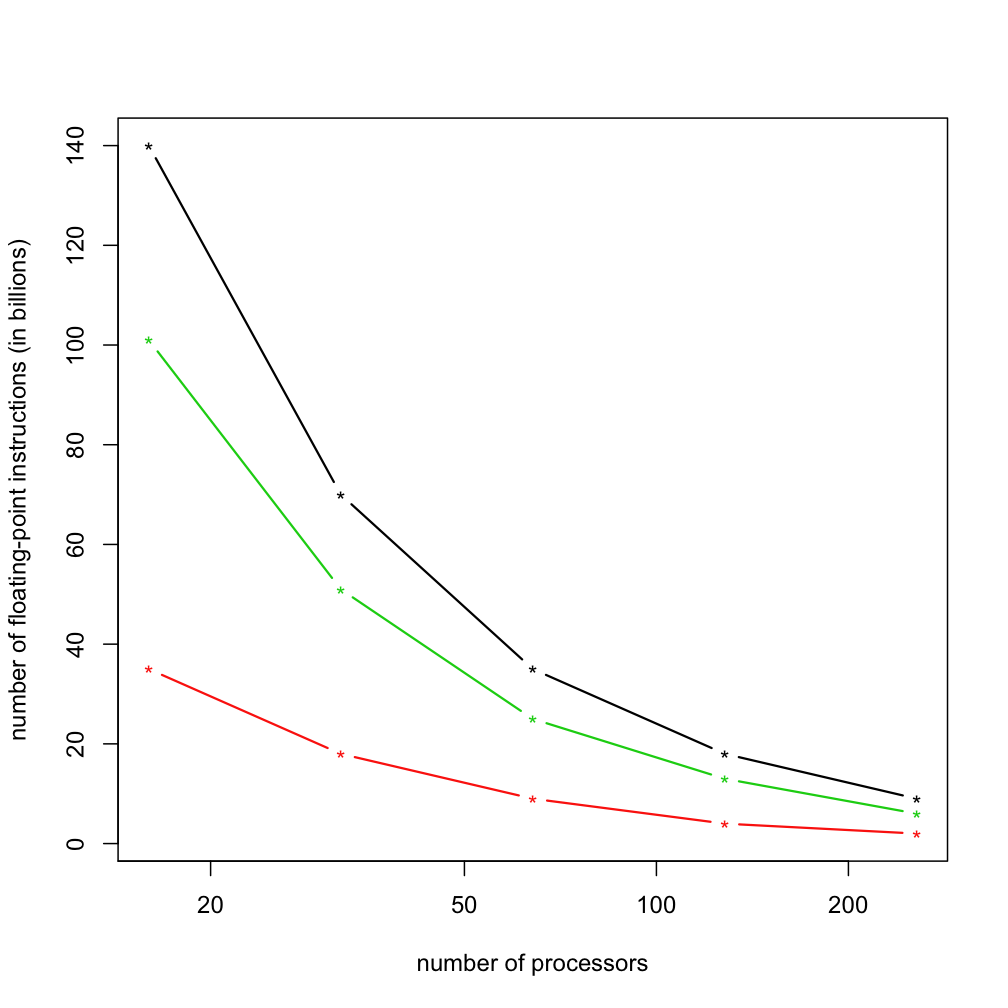
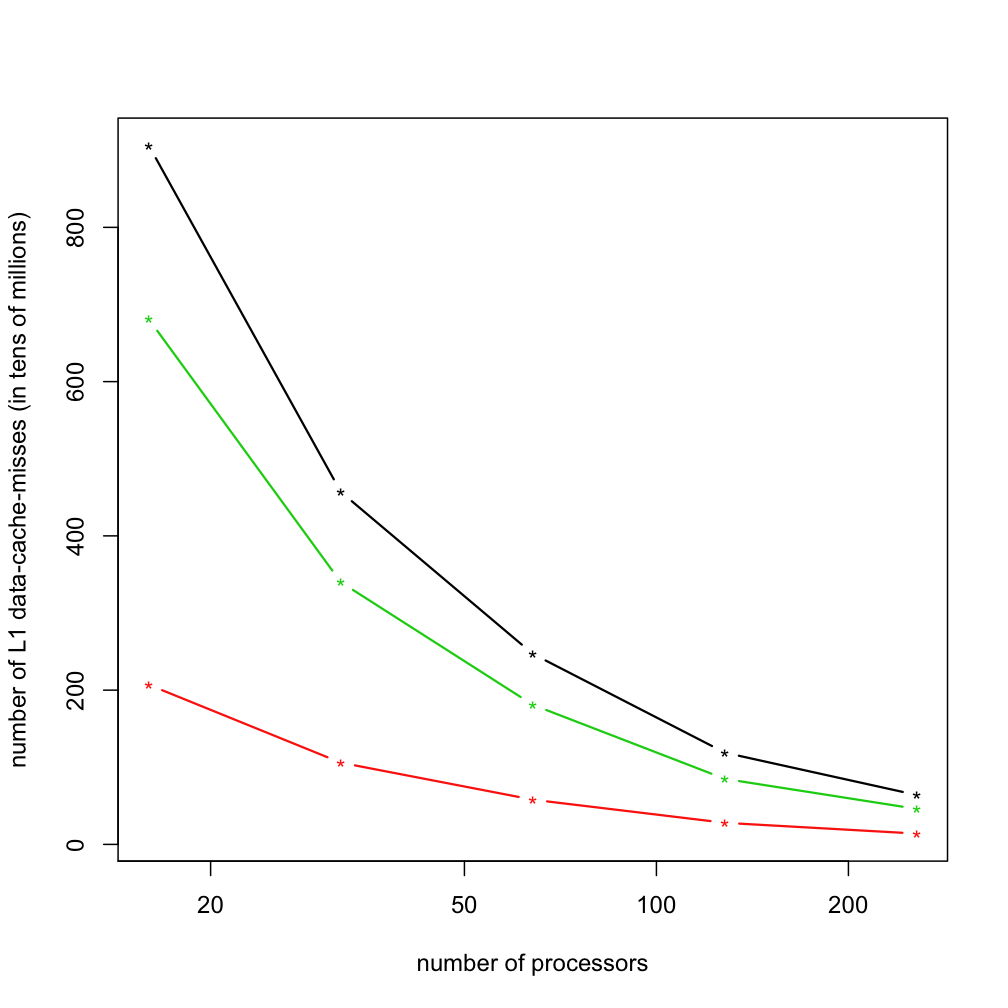
We have found two loops in the source file "h_cvectr_multi.c" that together account for about 90% (with 16 processors) of the runtime of the NEMO3D application. Loop 1 starts at 1235 and ends at 1841. Loop 2 starts at 1270 and ends at 1760.
Runtime Breakdown Charts
These charts show the runtime breakdown of NEMO3D on processor counts 16,32,64,128,256. Each experiment was run on PSC's SGI Altix system (pople).
Legend
Entire Experiment Loop 1 Loop 2


